Crypto Market Sentiment & Unusual Activity
Know which way the market leans on every timeframe, and get pinged the minute a coin's volume explodes.
What you get
Sentiment on four timeframes at once
Bullish, bearish and neutral percentages across the top symbols on 15m, 1h, 4h and 1d, so you can see when short-term mood diverges from the trend.
One overall trend and risk level
The timeframes are combined into a single trend call and a risk rating, which is the quickest possible answer to the question should I be trading today.
Sentiment history
Scroll back through how the readings evolved to see whether the current mood is a fresh shift or a long-running regime.
Hunter: pumps and dumps as they start
The Hunter watches 1-minute volume on every pair and flags a pump or dump when volume jumps 500 percent or more above its baseline.
Unusual Activity with fake-volume filtering
Abnormal buy or sell volume is surfaced per symbol, with checks that discount wash trading and other manufactured volume.
Live prices, charts and tagged news
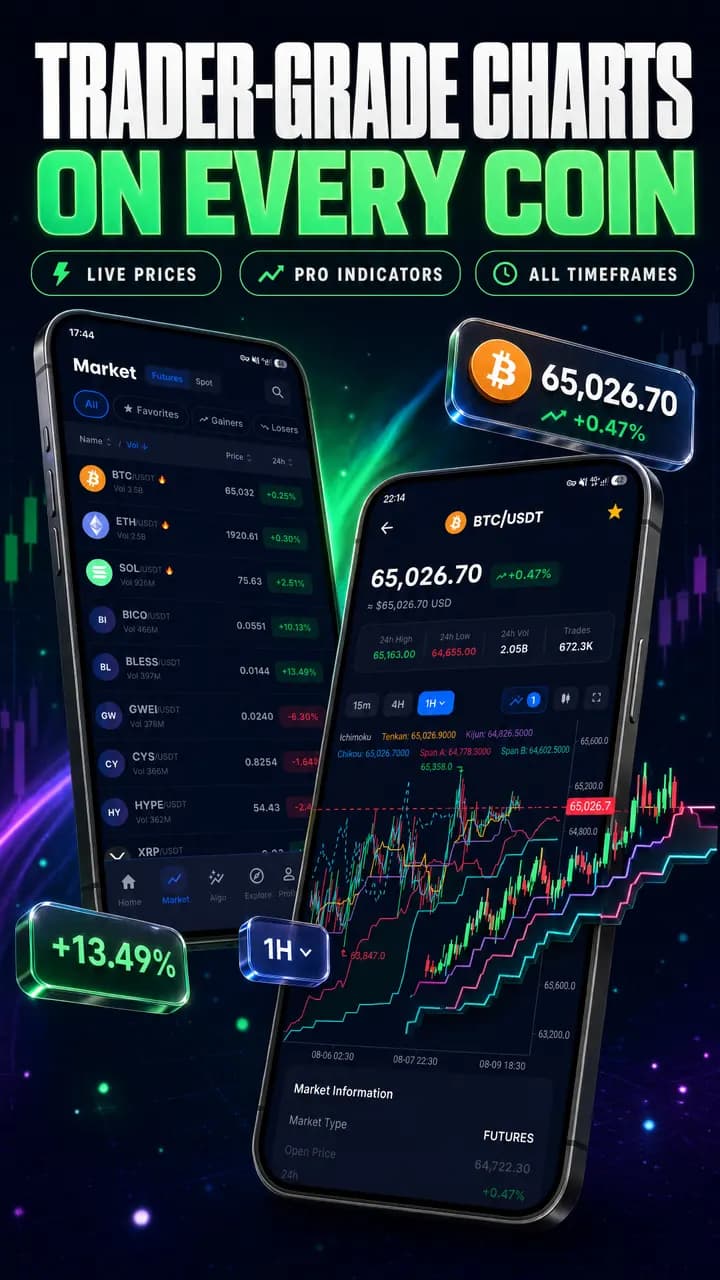
Over 600 USDT futures pairs with professional charts, plus aggregated crypto news tagged by sentiment.
How it works
- Step 1
Sentiment is computed per timeframe
Top symbols are classified bullish, bearish or neutral on 15m, 1h, 4h and 1d using trend and momentum indicators, and the percentages are shown side by side.
- Step 2
The readings roll up into trend and risk
A single overall trend and a risk level are derived from how strongly and how consistently the timeframes agree.
- Step 3
Hunter and Unusual Activity watch the tape
Every pair is monitored on 1-minute candles for volume spikes and buy or sell imbalances; qualifying events become Hunter or Unusual Activity entries.
- Step 4
You get alerted and drill in
Tap any event to open the chart, check whether the spike had real follow-through and decide whether it fits your plan.
Reading multi-timeframe sentiment
The Market screen answers a question most traders answer badly by gut: what is the market actually doing right now? For each of the four timeframes, Sindex classifies the leading symbols as bullish, bearish or neutral from their trend and momentum readings and shows the split as percentages. When 15m and 1h are mostly bearish but 4h and 1d remain bullish, you are looking at a pullback inside an uptrend, and shorts are fighting the larger flow. When all four agree, the move has real weight behind it.
The overall trend and the risk level compress those percentages into two words. High risk usually means the timeframes disagree or the readings are flipping quickly — conditions where stops get hit by noise and position size should come down. The sentiment history lets you see whether today's reading is a one-day wobble or the tenth day of the same regime. A practical routine is to check this screen once before the trading day: if the 1d and 4h readings are bullish, favour long signals and scanner setups; if they are split, cut size or sit out.
Hunter: catching pumps and dumps from 1-minute volume
Sudden moves in crypto almost always start with volume, not price. The Hunter watches 1-minute candles across the futures universe and raises an event when volume jumps by 500 percent or more against its recent baseline while price moves in the same direction. Each event records the symbol, the direction (pump or dump), the volume increase, the gain so far and a ping count that rises if the spike keeps repeating; entries are graded strong, medium or weak and carry a star rating so you can filter to the ones worth a look.
Traders use the Hunter two ways. Momentum traders take the first minutes of a strong pump with a tight stop, accepting many small losses for the occasional large run. Mean-reversion traders wait for the pump to exhaust — volume fading while price stalls — and fade it. Either way, the event is a prompt to open the chart, not an instruction to buy.
Unusual Activity, fake volume and risk
Unusual Activity looks at a slower signal than the Hunter: sustained buy or sell volume that is out of line with a symbol's normal behaviour, which often precedes a directional move. Because exchange volume can be manufactured, the detector runs a fake-volume check that discounts patterns typical of wash trading before an event is shown, so a coin with inflated numbers does not top the list every day.
Volume-based alerts are among the fastest-moving signals in the app, which is exactly why they need the most discipline. Chasing a pump that is already several minutes old is one of the most reliable ways to lose money in crypto. Use a stop from the first second, size small, and remember that none of this is financial advice.
Related strategies
Learn more
What Are Crypto Trading Signals? A Plain-English Guide
A crypto trading signal is a specific trade idea with an entry, targets and a stop-loss. Here is what a good one contains, where signals come from, and how to tell a real track record from marketing.
Crypto Market Sentiment Explained: Breadth, Trend and Risk
Market sentiment tells you whether the tide is coming in or going out. Learn how breadth across 15m, 1h, 4h and 1d timeframes, dominant trend, risk level and volume anomalies are measured, and why sentiment should filter your trades rather than trigger them.
Crypto Portfolio Rebalancing: Threshold vs Calendar Methods
Rebalancing is how you stop one lucky coin from becoming your whole portfolio. This guide compares threshold and calendar methods, explains concentration risk and market-phase awareness, and shows how to review AI-generated suggestions safely.
Other features
Frequently asked questions
- How is sentiment calculated?
- For each timeframe, the leading futures symbols are classified as bullish, bearish or neutral from trend and momentum indicators on their candles. The percentages you see are the share of symbols in each state, and the overall trend and risk level summarise how the four timeframes agree.
- What triggers a Hunter event?
- A 1-minute volume increase of 500 percent or more against the recent baseline, with price moving in the same direction. Events are tagged pump or dump, graded strong, medium or weak and gain ping counts if the spike repeats.
- What is the difference between Hunter and Unusual Activity?
- Hunter reacts to sharp volume spikes on 1-minute candles and is the fastest alert in the app. Unusual Activity tracks buy or sell volume that stays abnormal over a longer window and applies fake-volume filtering, so it is slower but cleaner.
- Which pairs are covered?
- Live prices, charts, Hunter and Unusual Activity cover more than 600 USDT perpetual futures pairs. Sentiment percentages are computed across the top symbols by relevance so the reading reflects the market that matters.
- Is the Market screen free?
- Prices, charts and the market overview are available to free users. Pro unlocks the full signals feed, tracked channels and the aggregated news view; Premium adds Algo Forge and the Portfolio Strategist.
Trade with an edge — get Sindex AI
Free to start. Real-time signals, AI strategies and portfolio tools on Android, iOS and the web.