Crypto Strategy Scanner
Eighteen classic strategies, five categories, every USDT futures pair — find which coins match your setup right now instead of flipping through charts.
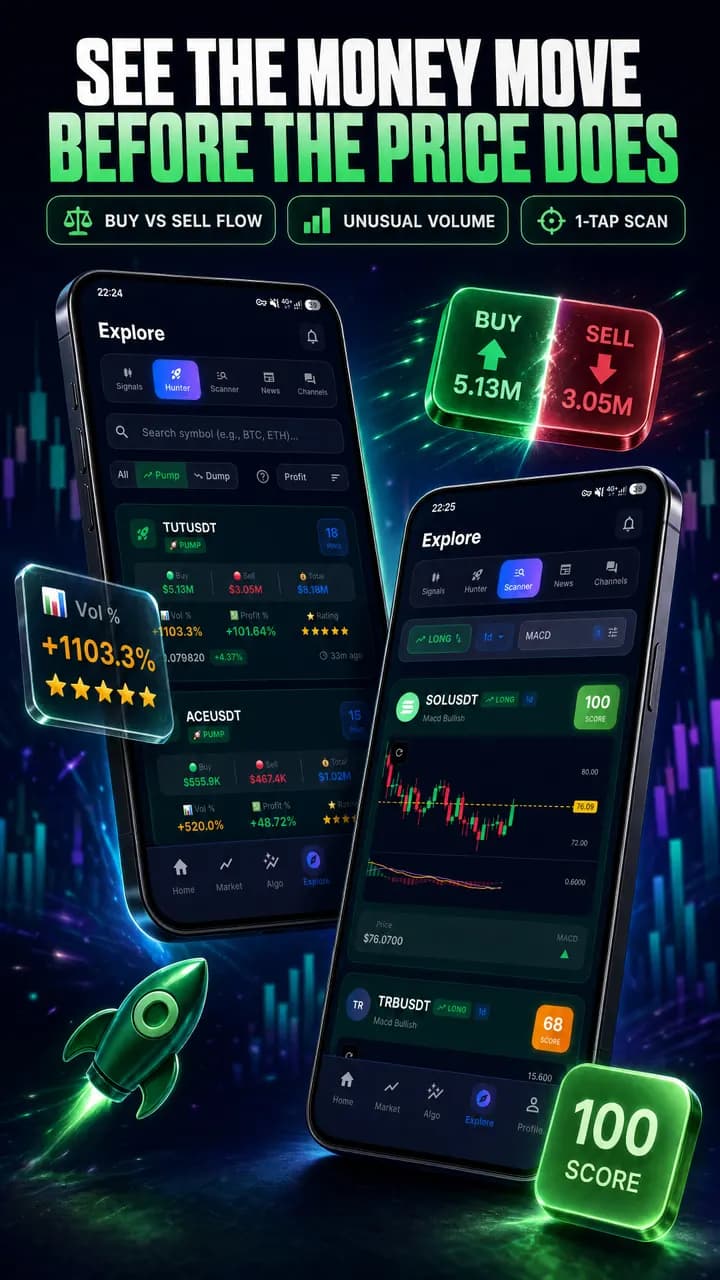
What you get
18 setups across 5 categories
Trend, momentum, volatility, volume and Ichimoku cloud strategies, each with a long and a short variant where it makes sense.
Whole-market coverage
Every scan runs across the full USDT futures universe, so the small-cap pair that just formed a Golden Cross is found alongside BTC and ETH.
Per-timeframe results
See which symbols match on 15m, 1h, 4h and 1d separately. Confluence across timeframes is one tap away.
Plain-language strategy pages
Each strategy has its own guide explaining the indicators, the entry and exit logic and the conditions where it tends to fail.
Straight into the chart
Tap a matched symbol to open its live chart with the relevant indicators, then check the AI signals feed for the same pair.
How it works
- Step 1
Pick a strategy and a timeframe
Choose from the 18 setups, for example RSI Oversold on the 4h, or browse by category if you are looking for an idea.
- Step 2
Sindex scans every futures pair
Indicator values are computed from fresh candles for each symbol and checked against the strategy's rules.
- Step 3
Review the matches
Matching symbols are listed with the key indicator readings. Cross-check the same coin on a higher timeframe before acting.
- Step 4
Plan the trade
Open the chart, define your invalidation level and target, and size the position before you place anything.
The 18 setups, by category
The scanner groups its strategies into five families so you can reach for the right tool. Trend strategies look for regime changes: the Golden Cross and Death Cross (a fast moving average crossing a slow one) and the EMA Ribbon in bullish or bearish alignment, where a stack of exponential averages fans out in one direction. Momentum strategies catch stretched conditions: RSI oversold and overbought, MACD bullish and bearish crossovers, and Stochastic oversold and overbought. Volatility strategies include the Bollinger Squeeze, long and short, which flags bands that have contracted ahead of an expansion, plus Support and Resistance level detection. The volume family has Volume Breakout long and short, which requires volume of at least twice the recent average on the breakout candle. Finally the cloud family covers Ichimoku bullish and bearish, where price, the Tenkan-Kijun cross and the cloud all agree.
- Trend: Golden Cross, Death Cross, EMA Ribbon bullish, EMA Ribbon bearish
- Momentum: RSI oversold, RSI overbought, MACD bullish, MACD bearish, Stochastic oversold, Stochastic overbought
- Volatility: Bollinger Squeeze long, Bollinger Squeeze short, Support level, Resistance level
- Volume: Volume Breakout long, Volume Breakout short (2x average volume)
- Cloud: Ichimoku bullish, Ichimoku bearish
How traders actually use the scanner
The most reliable way to use a scanner is as a shortlist generator, not as a trade trigger. A common routine is to scan a mean-reversion setup such as RSI Oversold on the 1h, then check whether the same symbols appear in a trend setup on the 4h or 1d. A coin that is oversold on a low timeframe while its higher-timeframe EMA ribbon is still bullish is a pullback in an uptrend, which is a far better long than an oversold coin in a downtrend. The reverse applies to shorts.
Scanner results also pair well with the AI signals feed. If a symbol shows up as a Volume Breakout long and the engine has an open long on it with a compatible entry range, the two sources agree and your conviction should be higher. When they disagree, that is useful information too.
What a scanner cannot do
A match means the indicator conditions are true right now; it says nothing about news, funding rates or liquidity. Momentum setups in particular produce many matches in a trending market that keep matching while price runs further. Always define where the idea is wrong before entering, keep position size small relative to your account, and remember that technical analysis is a probabilistic edge at best. Nothing in the scanner is financial advice.
Two habits make scanner results far more useful. First, glance at the Market screen before you scan: if the overall risk level is high and the timeframes disagree, long setups and short setups will both be firing, and fewer of them will follow through. Second, keep a short watchlist of matches instead of trading the first one — the coin that matches on 1h now and on 4h an hour later is the one worth your attention.
Related strategies
Learn more
How to Backtest a Crypto Strategy Without Fooling Yourself
Backtesting tells you whether a trading idea has ever worked. Here is how to define rules, pick data, read the metrics that matter, avoid overfitting, account for fees and slippage, and move safely to live automation.
Crypto Market Sentiment Explained: Breadth, Trend and Risk
Market sentiment tells you whether the tide is coming in or going out. Learn how breadth across 15m, 1h, 4h and 1d timeframes, dominant trend, risk level and volume anomalies are measured, and why sentiment should filter your trades rather than trigger them.
AI Crypto Trading Explained: What It Does and What It Can't
AI is everywhere in crypto marketing and almost nowhere in the explanations. Here is what AI trading systems actually do, what they cannot do, how to keep a human in the loop and how to judge whether an 'AI' product is real.
Other features
Frequently asked questions
- Which markets does the scanner cover?
- It scans USDT-margined perpetual futures pairs — the same universe the signals engine trades, which is over 600 symbols. Spot-only coins are not included.
- Which timeframes are available?
- Results are computed per timeframe on 15m, 1h, 4h and 1d. Scanning the same strategy on two timeframes is the quickest way to find confluence.
- How fresh are the results?
- Indicators are recalculated from recent candles on each scan, so what you see reflects the current candle set. A match can disappear on the next candle if conditions change, which is normal for intraday timeframes.
- Is the scanner included in the free plan?
- The scanner is part of the Pro plan alongside the full signals feed, channels and news. Premium adds Algo Forge and the Portfolio Strategist.
- Can I turn a scanner setup into an automated strategy?
- Yes. Every one of the 18 setups can be rebuilt in Algo Forge with the same indicators, backtested on historical candles and then run live with alerts or auto-trading.
Trade with an edge — get Sindex AI
Free to start. Real-time signals, AI strategies and portfolio tools on Android, iOS and the web.